Corona Discharge and Aura Software: Following Two Image Pipelines

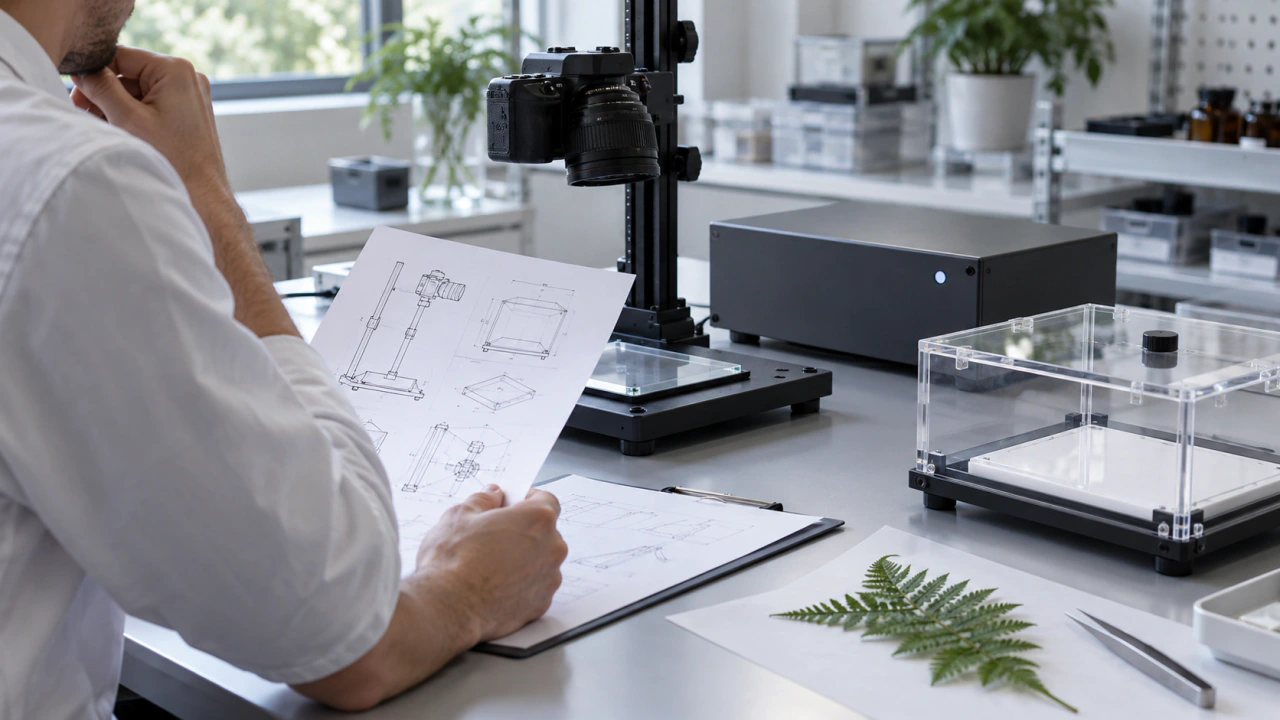
To understand an image, follow the steps that produced it. I would explain corona-discharge photography and a modern aura software presentation through two separate workflow diagrams, then identify the input, transformations and saved output at each stage. That approach gives a viewer useful questions to ask.
Begin with the origin of the picture
A finished image can be an engaging place to start a conversation, but its appearance is only one part of its history. Ask where the visible material originated and how it reached the final file. Keep that explanation close to the image, especially when a presentation brings together different technologies.
For this guide, a pipeline means an ordered account of those steps. It is a practical communication tool: identify what entered the workflow, describe the operations applied to it and show what was preserved. The same worksheet can organize two processes while keeping their different origins clear.
Follow the corona-recording path
Pehek, Kyler and Faust describe the Kirlian image as a photographic record of corona activity during an exposure. Their abstract also discusses how recording conditions influence the resulting image. Primary research, 1976.
A later study by Halahmi and Kronik used a transparent electrode to keep photographic film outside the discharge. Its abstract reports color changes associated with material in the discharge and describes the possibility of deliberately shaping color patterns. Primary research, 1996.
These are two identified research configurations. Use them as a reason to request a description of the particular recording process behind the image you are discussing. Ask which apparatus and recording method were used, which contextual notes survive, and whether you are looking at the original supplied record or a later presentation.
On your diagram, label the first available record clearly. If your archive begins with a scan or delivered digital file, say so. Add earlier steps only when supporting documentation is available. A complete-looking diagram is less useful than an honest one with an explicit gap.
Follow the software presentation path
For a modern aura software product, begin by asking its supplier to identify the inputs accepted by that exact product and version. Request an explanation that separates the incoming material from the controls used to create the display. The answer should establish the workflow you describe.
If a product accepts a camera image, sensor values or imported files, give each input its own label. Ask which inputs are required, which are optional and which appear directly in the saved image. Avoid filling in the diagram from a familiar-looking screen or another product's documentation.
In this worksheet, I use processing for the documented transformations between input and presentation, and rendering for assembling the visible output. Ask the supplier which steps fit those labels. Request an example connecting an identified input record, an application version, relevant settings and the resulting export.
This makes the explanation specific and constructive. A viewer can understand the role assigned to an input, the choices made in the application and the form of the saved result. Any part the supplier has not described can remain an open question.
Name the layers in a combined visual
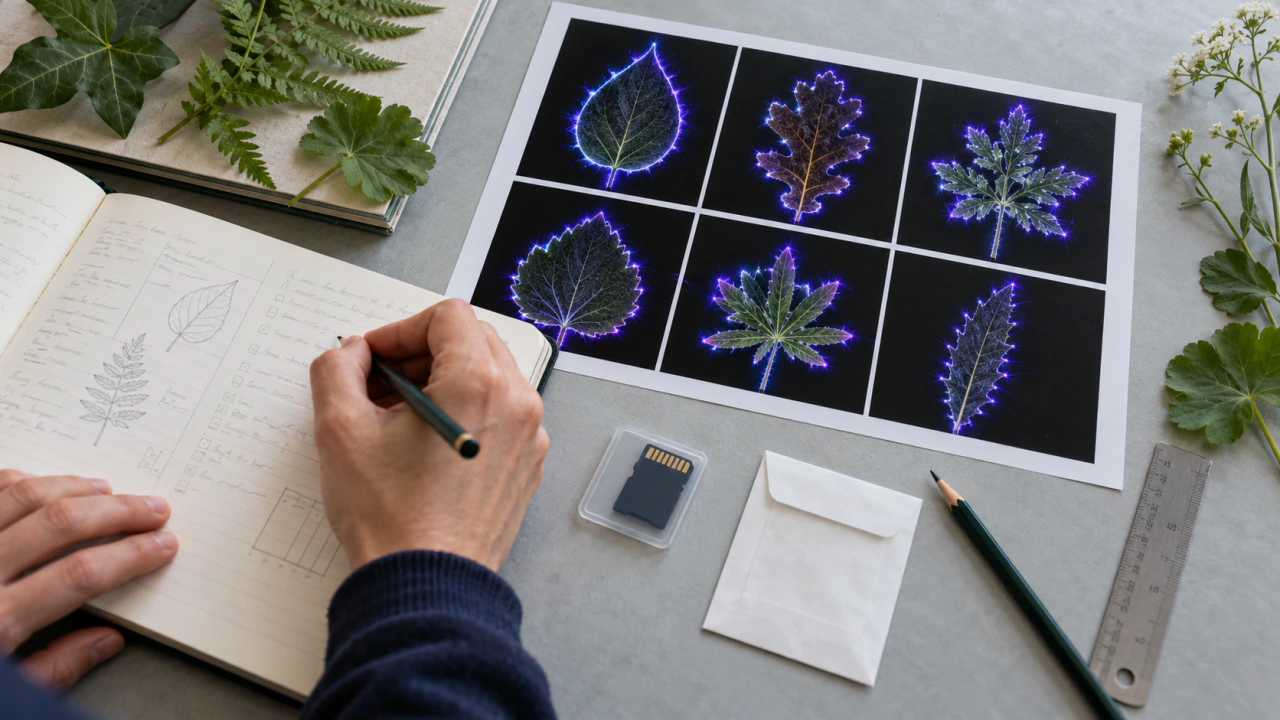
When a finished picture combines several elements, describe them separately. A useful layer list might distinguish a supplied photograph, a generated visual element, a graph, interface labels and editorial annotations. Include only the elements actually present in the documented example.
Ask which elements came from recorded material and which were added through software or later editing. For each added element, note its source and purpose. A caption can then explain the composition positively: what the viewer is seeing, where it came from and how it was prepared.
If you commission an illustration to explain either workflow, label it as an illustration. Keep its reference material and production notes separate from original captures and application exports. That allows the illustration to teach the process without becoming confused with evidence from the process itself.
Compare the explanations before the appearances
Place the two diagrams side by side and use the same four headings: input, transformation, output and documentation. Under each heading, write the available facts for that example. Shared headings make the comparison readable; the entries preserve the particular process.
Next, choose the question you want the comparison to answer. You could examine how well each supplier documents an export, how an archive records revisions or what a viewer needs to understand a display. These are focused comparisons with identifiable evidence. Similar colors alone would give you a much thinner explanation.
Keep file roles consistent in the layout. Compare supplied records with supplied records, or clearly identify a presentation version beside its source. Where the available material differs, name the difference and explain how it affects the comparison you chose.
Give the viewer a short route back to the source
Finish each example with a compact provenance note: source, process description, product or apparatus identification when known, preparation history and saved-file reference. Put longer technical documents in the accompanying archive rather than crowding every caption.
An effective explanation leaves the viewer with a clear chain to follow and a sensible next question. Use a structured capture log to retain that chain, consult the procurement checklist when evaluating a supplier, or explore KirlianTech.